
- Home
- Publications
- GIEI Quarterly
GIEI Quarterly
Index readings for 31 markets and 10 sectors, and the corridors and sectors that moved. Four reports a year, in English.
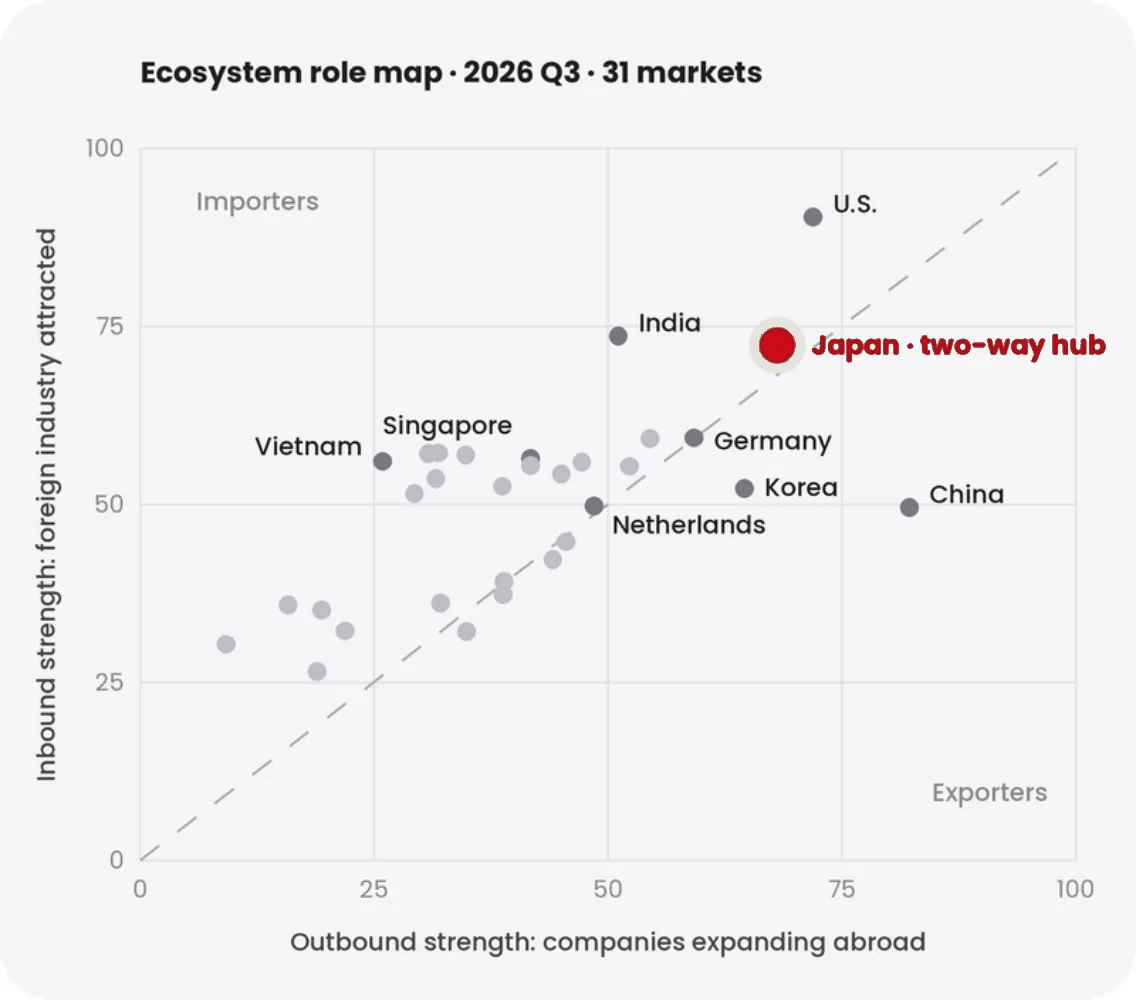
What the latest report shows
Announced industrial projects in both directions, 2026 Q3, change vs Q2
Five parts, the same every quarter
- 01
Composite and pillars
The global reading and its four pillars
- 02
31 market scores
Inbound and outbound, with ranks and changes
- 03
Corridors
The busiest two-way routes between markets
- 04
Ten sectors
Which sectors moved, and where
- 05
Method and sources
How the numbers are built, and what they cannot tell you
Get each new publication by email
Published in English on the third Tuesday of every month.
Index figures are compiled from official statistics, announced industrial projects, company announcements and WIPO PCT statistics. JHC strives for accuracy but makes no warranty as to completeness, accuracy or timeliness. The index is information, not investment advice.
Join the global industrial ecosystem

Request a consultation
For companies entering Japan or expanding abroad from Japan: a complimentary 30-minute call with our Tokyo team to discuss your plans.
Request a consultation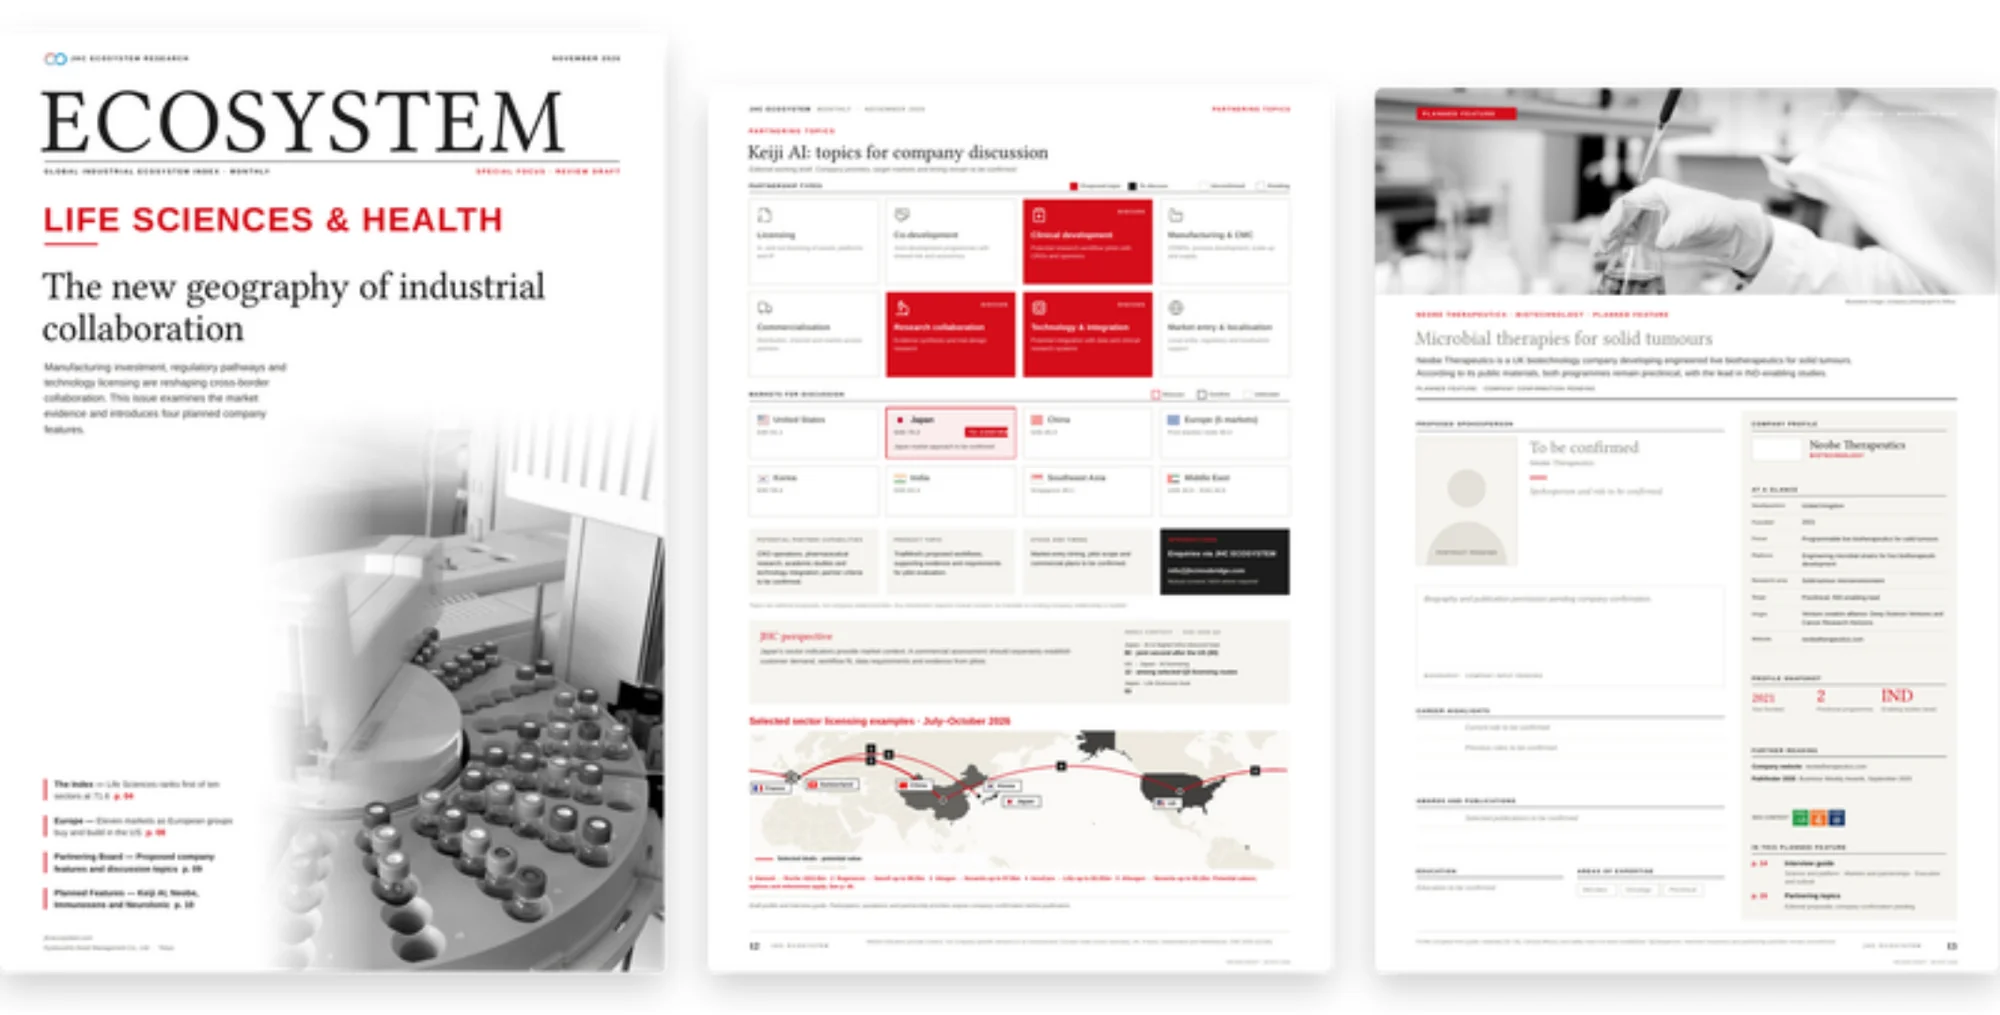
Subscribe to our publications
For executives following cross-border industry: index readings, cross-border cases and partnering needs, delivered by email.
Subscribe