

Every market gets two scores. Together they show its role in the global industrial ecosystem.
Inbound score
How well a market absorbs foreign industry: production, R&D, sales, service and licensing by overseas companies. Japan: 72.3, 3rd of 31.
Japan Desk: our inbound serviceOutbound score
How strongly a market’s companies expand abroad: production, R&D, sales, service and licensing overseas. Japan: 68.1, 3rd of 31.
Global Desk: our outbound service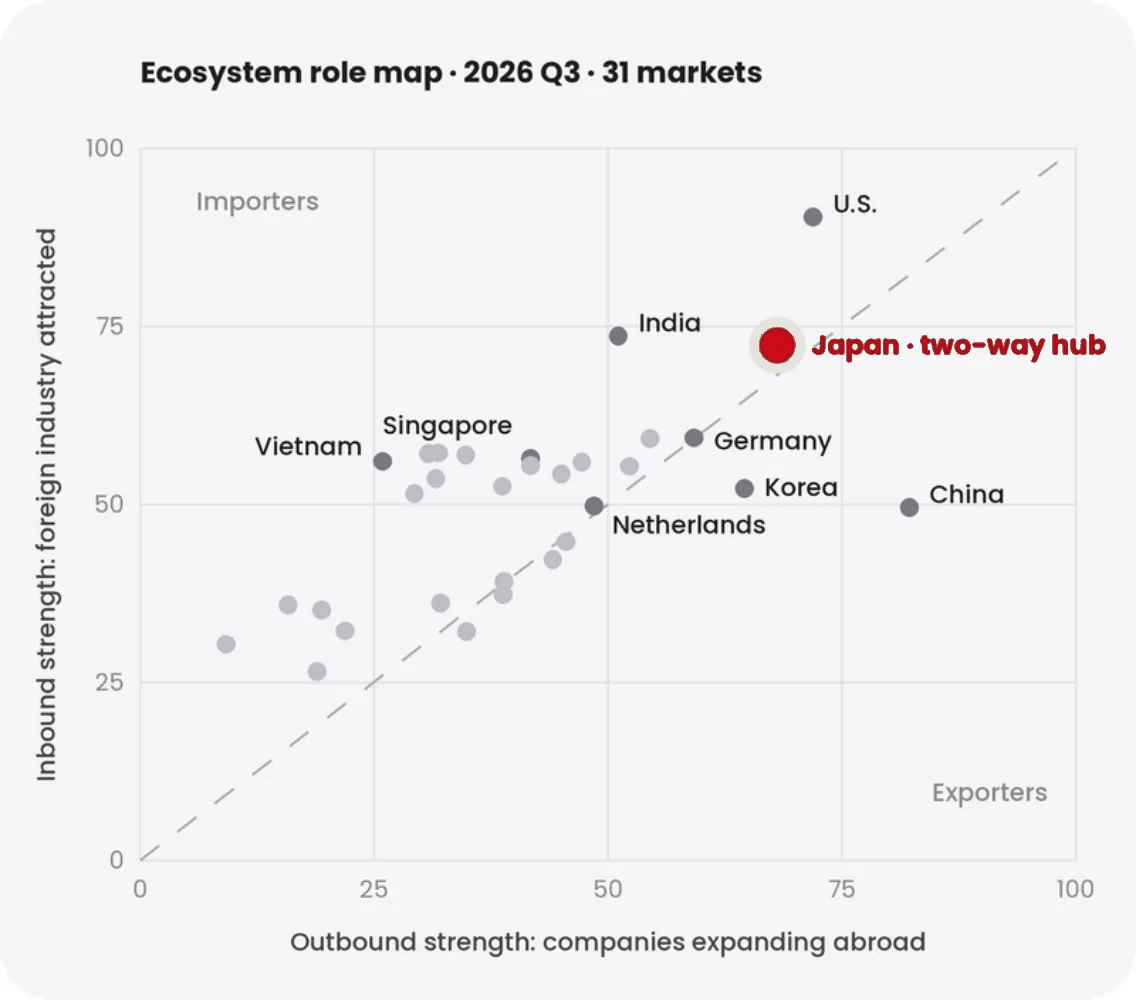
Economic value
The economic weight of cross-border industrial activity.
Scale and connectivity
How many projects and partner markets a market is linked to.
Collaboration and licensing
Joint development, licensing and partnerships across borders.
Innovation and evolution
Patent activity and how fast the ecosystem is changing.
- Production
- R&D
- Sales
- Service
- Licensing
- Official statistics
- Announced industrial projects
- Company announcements
- WIPO PCT statistics
Announced industrial projects in both directions, 2026 Q3, change vs Q2
Index figures are compiled from official statistics, announced industrial projects, company announcements and WIPO PCT statistics. JHC strives for accuracy but makes no warranty as to completeness, accuracy or timeliness. The index is information, not investment advice.
Join the global industrial ecosystem

Request a consultation
For companies entering Japan or expanding abroad from Japan: a complimentary 30-minute call with our Tokyo team to discuss your plans.
Request a consultation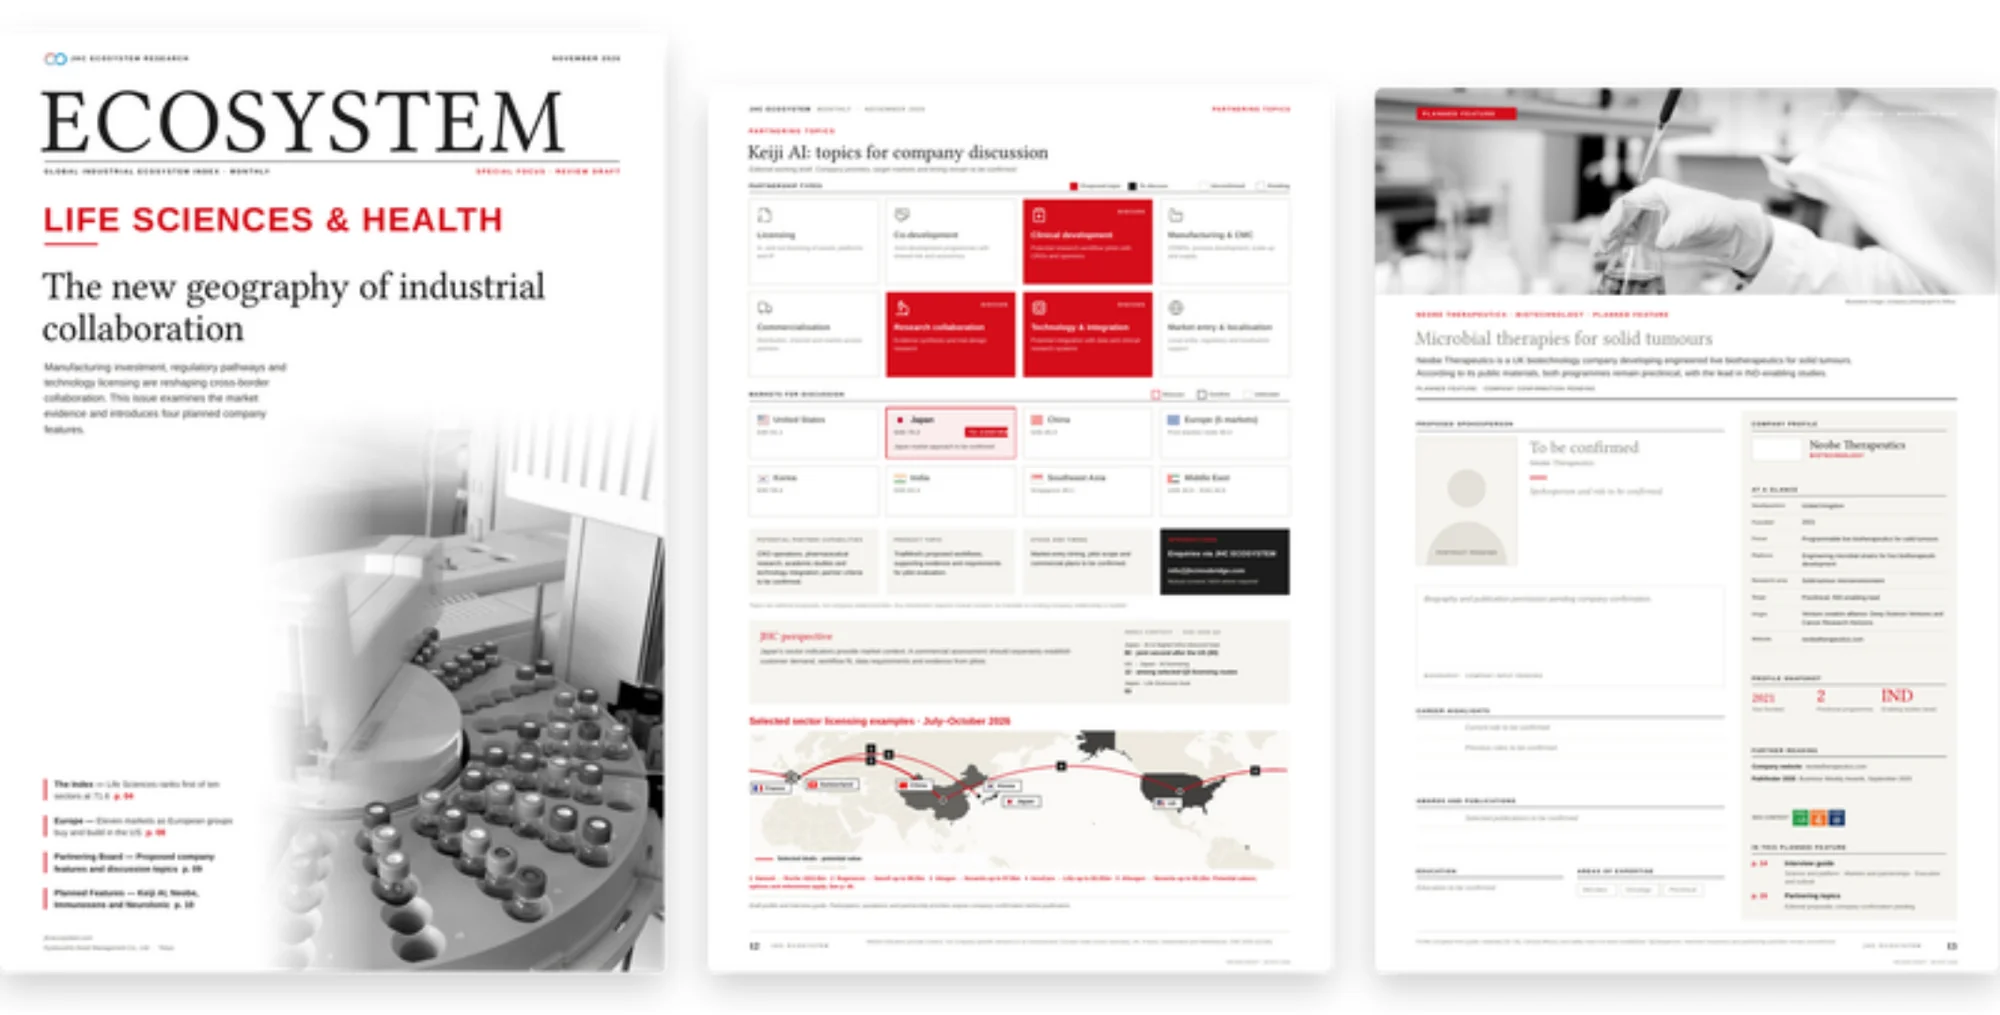
Subscribe to our publications
For executives following cross-border industry: index readings, cross-border cases and partnering needs, delivered by email.
Subscribe